CASE STUDY in TRIZ: ‘Global Benchmark’ Evaluation of Thermal Comfort in Sports Equipment
Editor | On 10, Dec 2003
Simon Dewulf
CREAX nv
simon.dewulf@creax.com
Vincent Ventenat
DECATHLON sa
vincent.ventenat@decathlon.fr
Darrell Mann
CREAX NV
darrell.mann@creax.com
INTRODUCTION
The research area of thermal comfort in sporting equipment has been evaluated in terms of TRIZ. The article presents a number of generically applicable methods that can be used to evaluate and benchmark the current maturity of the technologies present in any area of technology or business against a global standard. The methods are intended to fit together to form a comprehensive whole that will permit users to quantifiably measure their competitiveness relative to competitors. The method also provides a range of information enabling users to chart future strategy in a uniquely effective manner.
The article represents the output produced for a real strategic study. For obvious commercial reasons, some details have been omitted and the emphasis has shifted to the method rather than the specific answers of the study.
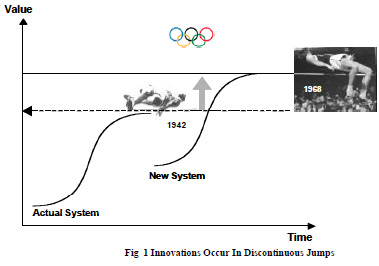
The overall method of ‘global benchmarking’ presented here consists of three main parts. The presence of these parts is largely driven by the importance of discontinuity in determining innovation success. As indicated in Figure 1, successful innovations emerge by shifting s-curves. These shifts may occur at the level of individual components, at the overall system level, or at any intermediate hierarchical level. The three primary mechanisms by which systems advance from one s-curve to the next involve either:
· the resolution of a conflict or contradiction
· shifting to another means of delivering a function
· shifting to another stage on the map of discontinuous trend jumps
The article examines each of these three mechanisms individually in the context of the thermal comfort case study.
CONFLICTS and CONTRADICTIONS
In the first phase (actually, the sequence is not usually of importance, this is just the sequence we happened to use in this study) the conflicts of a system can be listed. Sports equipment have (as all industries) a defined set of parameters that designers wish to improve – durability, weight, softness, heat, cold permeability, thickness, length, security, flexibility, strength just to name a few – and know that in each case something prevents them from making those improvements. The conflicts and contradictions can be extracted by common sense, out of product analysis or patents in the field. Fig 2 shows a typical conflict identification analysis as done by the CREAX research team during the search for inventive solutions.

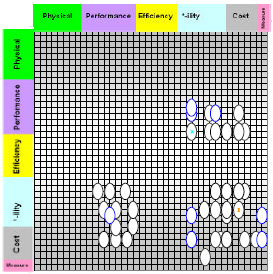
In the thermal comfort sector, several hundred patents underwent this kind of analysis. The main aim of the analysis was to determine what issues the industry was focusing on and to identify possible areas of opportunity. This kind of analysis is helped considerably by the re-arrangement of parameters found in the new Contradiction Matrix (Reference 1). As shown in Figure 3, the sequence of the 48 parameters found in the new Matrix form a progression that correlates strongly with the maturity of the systems under evaluation, and therefore on the benefit, cost and harm aspects of the ideality equation. Note also how the ‘interface’ parameter, seen frequently as a theme in several TRIZ tools, correlates well in this progression of main focus during the life of the scurve.
Extensive research onto different product areas in the field of Thermal comfort showed a contradiction resolution map rather clustered in certain areas of the conflict matrix. Figure 4 shows that the patents are mainly focused in the lower right side of the matrix, i.e. in the cost-reduction, optimisation area. While this type of cost reduction, ‘ility improvement activity is absolutely fundamental to continuing business success, the fact that ALL intellectual property found in the thermal comfort arena was confined to cluster areas in this lower portion of the Matrix was seen as both a threat and an opportunity. A threat because it meant the sector was potentially vulnerable to incursion by big jumps coming from outside, and an opportunity because if the company could identify such jumps before outsiders, it would be possible to drive the next major evolutions.
The study at this stage, may well shift to other industry sectors to identify those areas that might be generating solutions to more fundamental conflict situations. We might examine, for example, how the aerospace or bio -sciences sectors (both much more able to fund large-scale fundamental research) are developing inventive solutions to the same sorts of contradictions known about but not being solved in the thermal comfort arena.
FUNCTIONALITY
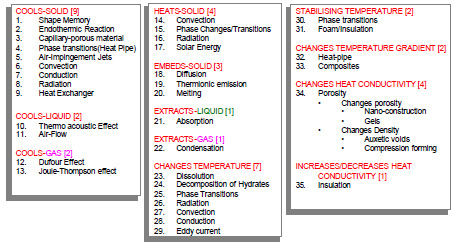
For the second benchmarking method the study examined function and functionality in more detail. Knowledge has been classified by function (Reference 2)) as a means of rapidly identifying opportunities to import solutions from other industries. In the case of the thermal comfort project, the main functions and attributes of interest are reproduced in Figures 5 and 6.
The easy awareness of other ways of delivering functions offered by TRIZ-based function databases makes it possible to benchmark on a glo bal scale very quickly. A useful way of comparing each of the capabilities of each functional solution involves relating attribute requirements with capabilities of the different functions. Thus, to take a simple example, knowing the amount of heat generated by a human foot during exercise, and the amount of space available within and around a sports shoe, it is possible to identify which of the different ways of delivering the thermal comfort functions best solves the heat versus volume conflict. Thinking back to the earlier contradiction section, it is also possible to map different effects onto the Matrix structure and to show which solutions are best able to solve which contradictions.
EVOLUTIONARY POTENTIAL ®
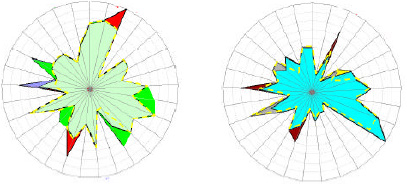
The third global benchmark focus area relates to the trends of evolution part of the systemic innovation toolkit. In this case, all materials and systems present in the area of thermal comfort can be evaluated in terms of trends of evolution. The evolutionary potential evaluation tool represents a simple way of presenting considerable amounts of information about a system (or its sub-systems), as well as the comparison of different competing products.
In this type of study – where many similar systems are being compared to one another – it is important to define a set of common rules regarding which of the trends will be included in the analysis, and how the stages on each will be interpreted.
For the thermal comfort study on shoes, for example, because the market contains a large number of makes and models at similar evolutionary states, it was possible to construct a base-line evolution potential radar plot, and determine consistent interpretation rules. Thus, for example, in the well known Space Segmentation trend, any product featuring Gore-Texä or a similar material was deemed to be at the fourth stage (use of capillary pores) of the five possible stages. As indicated in Figure 5, a set of base-line rules was agreed by the analysis team regarding these interpretation rules and also which trends were going to be included in the analysis.
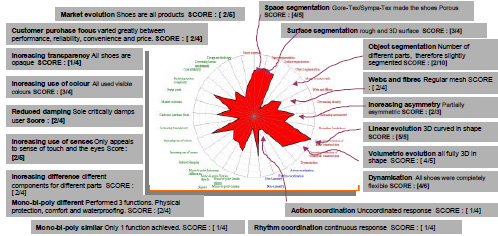
Once the baseline rules are agreed, all of the thermal comfort products were evaluated in terms of the trends listed in Figure 5. As those familiar with the CREAX Evolution trends will know, they have been subclassified into SPACE, TIME and INTERFACE trends (Reference 3). Although not shown here, this sub-classification enables patterns of strength and weakness to be inferred. Time issues in sports, for example, were observed to be still at a relatively immature state compared to physical aspects. These time issues can be seen as major conflict makers (now hot then cold, here hot there cold, etc). Figure 6 shows some of the comparative evolutionary potential ® plots produced during the research.
Based in the evolutionary potential plots, areas of future research can carefully be examined and ingredient material or partnering companies can be identified. Again, this part of the study generally involves comparison with the radar plots for other industries to see which have made the trend jumps that the thermal comfort sector has not yet made. By adopting a common datum upon which the analysis of different thermal comfort solutions can be produced, it becomes possible to contemplate a quantified approach to evolutionary potential. Converting a data-rich evolutionary potential plot into a single number or groups of numbers carries a number of dangers, of course – not least of which is the loss of the richness contained in the innovations suggested by the untapped potential.
On the other hand, the old adage ‘what gets measured gets done’ often comes into pla y, and we conclude that what better thing to measure is there than the potential of a system to evolve to its ideal final result?
For each of the different solutions studied in the thermal comfort project, we produced a quantified value of evolutionary potential as illustrated in Figure 7. The identifiers of the different solutions have been removed for obvious commercial reasons.

The knowledge that a particular solution has used up 56% of its evolution potential may not help designers to invent a new one, but it will be able to calculate when they have found a better one. It also presents managers with metrics that help them to steer the innovation ship.
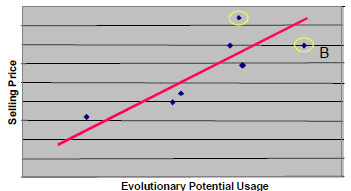
What was also done in this study, but is not fully presented here is to correlate evolutionary potential scores to commercial factors like selling price and manufacture cost. Figure 8 presents some non-dimensionalised date from the conducted analysis. What the analysis showed was that evolutionary potential usage and selling price were closely correlated. As such, we believe it becomes possible to use evolutionary potential as a means of helping to determine selling price for new products.
Evolutionary potential does not tell the full story of course – in Figure 8, product D is a successful product despite having an ‘inferior’ price/evolution-potential ratio thanks to very effective branding. But, on the other hand, since evolution potential is directly correlated to the actual ideality of a system, we believe that ultimately, product B has the best chance of winning any direct competition between the two provided its producer can get the marketing right.
This kind of analysis can also provide extremely useful strategic management data. As we will show in a follow-on paper, when we link this kind of quantified evolution analysis with QFD and the voice of the customer, then other very important strategic information emerges.
SUMMARY
Whether or not we agree with the need to measure things, benchmarking is an important managerial tool. TRIZ contradiction, function and particularly trend tools offer the potential to provide benchmarking information on a global scale. This is made possible since the TRIZ knowledge framework has been constructed by analyzing success from across the broadest possible of industries.
The case study presented here was used to answer important strategic questions for the company concerned. The traditional means of determining future strategy are normally built on sparse data and a large measure of gut-feel. For the first time, TRIZ makes it possible to devise and use quantifiable measures to compare different solutions.
Any valid quantitative approach to benchmarking needs to ensure consistency and appropriateness of the measures used. In this study, the most difficult part was undoubtedly defining the comparison standards illustrated in Figure 5. Anyone wishing to conduct a similar exercise for their own industry or range of products is advised to take particular care in this area.
REFERENCES
1) Mann, D.L., Dewulf, S., Zlotin, B., Zusman, A., ‘Matrix 2003: Updating the TRIZ Contradiction Matrix’, CREAX Press July 2003.
2) http://function.creax.com
3) Mann, D.L., ‘ Hands On Systematic Innovation’, CREAX Press, April 2002.
4) CREAX Newsletter, month year www.creax.com


