Decision Making for TRIZ
Editor | On 13, Feb 2006
Dr. David G. Ullman
Robust Decisions Inc
© Robust Decisions 2006 1
www.robustdecisions.com
TRIZ plays an important role in the new product development process. However, if the tools that interface with TRIZ are not sufficient, its impact on the final product can be hampered. The challenge with TRIZ is that the concepts developed are often in areas where information is uncertain, evolving, incomplete, and conflicting. The effort to decide which of the concepts to refine and perform detailed evaluation on is critical to the success of the effort. This paper explores a method that is equal to the task of helping decide how to manage the TRIZ concepts.
To facilitate this discussion, consider a project where, Bob, Marcus and Anne are charged with developing new concepts for a current product that is losing market share. They are following a process (Figure 1) which is part of a larger product development process (Ullman 2003). As shown, their main source for concept ideas is TRIZ.
They use TRIZ to develop three new concepts which they refer to as Concept 1, Concept 2, and Concept 3. A fourth option is to stay with the current product (don’t choose any of the new concepts), and finally, they may decide that none of the options are good enough and that they should develop additional concepts, shown as an arrow in the process back to the Alternative concepts box.
To evaluate the options, they develop a set of criteria – a mix of qualitative and quantitative measures. Although good practice says that all should be quantitative, there are some that are not worth refining at this stage in the development. For the quantitative criteria they agree on two targets, a delighted value and a disgusted value.
They use two targets because whenever they set a hard, single target in the past, they often relaxed it during deliberation and trade studies. They figured; why not admit that there is an ideal target (i.e. delighted), a second value beyond which an alternative is clearly not acceptable (i.e. disgusted), and a decreasing utility between them. The criteria and targets they developed are:
• Time to reduce to functional prototype
After some discussion they decided that they will be delighted if they can have a functional prototype in 3 months and disgusted if it takes 6 months.
• Availability of in-house expertise to develop
If they have the needed in-house expertise then they can save money on the project. This criterion is qualitative, based on their confidence that they have the needed expertise.
• Capital cost for production
They will be delighted if they can spend less than $100K and disgusted if it takes over $300K
• Production cost/unit
They will be delighted if their production costs are less than $4 and disgusted if it is over $10
• Differentiation from competition
This is a qualitative measure.
• Performance relative to competition
This is a qualitative measure.
• General appeal of concept
This is a qualitative measure.
When they begin discussing criteria they realize that they do not share a vision about which of them is most important. To improve their communication on this point they decide to rank order the criteria and develop the list in Figure 2. There is little agreement about this order and clearly no “right†importance weighting. They agree that if an alternative can be found that was satisfactory to all of them, regardless of importance view point, then they will truly have a concept they could all buy into.
Once they agree to disagree about importance they begin to discuss their evaluation of each of the alternatives relative to the each of the criteria. There was little analysis to do during the evaluation, as most of it was based on gut feel. However, they ran some low fidelity simulations on capital cost and production costs. They realized during evaluation that:
• There was a wide range of uncertainty in their evaluations. For example, Bob had developed a product similar to Concept 1 and so he had a good feel for the time it might take – i.e. he was certain of his time estimate, but his estimate of appeal was quite uncertain.
• On most of the evaluations there was disagreement.
• For some evaluations, some of the team members had little knowledge or interest and thus had no input – the evaluations were incomplete.
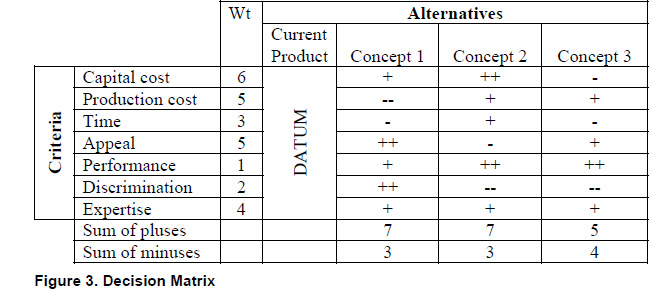
They decided to use a decision matrix (aka Pugh’s method (Pugh 1990)) to help them make a decision. A typical Decision Matrix is shown in Figure 3. In this method, the results of the evaluations of each alternative relative to each criterion are compared to one of the alternatives chosen as the datum, and combined to show an overall level of satisfaction.

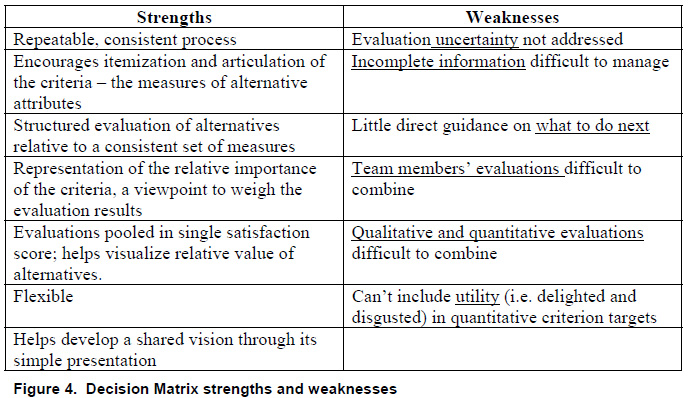
They had used the decision matrix before and liked it. It is a repeatable, consistent and flexible process to itemize the important criteria, enough to make it worthwhile. Further, the visual representation helped them begin to build a shared understanding. However, they concluded that this method may not be well suited to making decisions about TRIZ results and, therefore, made a list noting its strength and weaknesses, shown in Figure 4.
In detail, the weaknesses led the team to develop the requirements for a system that is well matched to the power of TRIZ. Such a system must:
• Manage Uncertainty
TRIZ produces concepts in which the uncertainty may be very high. By its very nature TRIZ pushes the users into areas that are new and novel. Here uncertainty results from the lack of knowledge about the concept. Knowledge is a property of cumulative experience and the amount of time spent on current or similar concepts. In the decision matrix we usually include some alternatives that are of existing products and some that are very new. The differences in uncertainty between these can be very high on some criteria, may differ from criteria to criteria, and may greatly affect the decisions made.
• Manage Incomplete Information
Often, when evaluating a new concept there are cells in the decision matrix where not enough is known to even venture a guess. In these cases, the evaluation isn’t that the concept in question is the same as the datum, it is unknown and it would be nice to be able to leave the cell blank.
• Guide What-to-do-next
The decision matrix can encourage the definition of new alternatives by suggesting how the combination of strong features of the current alternatives can be combined to give potentially better options. Further, if all the scores relative to a specific criterion are the same, or nearly so, it can suggest that the criterion is not helping differentiate among the alternatives. Beyond this guidance, it can not help guide what to do next, which arrow to follow and exactly what to do in Figure 1.
• Fuse distributed team evaluations
Usually, for a significant decision, a team will be involved in the evaluation and decisionmaking. In general, no one person will know all the information needed to make a decision, since each team member knows some unique part of it. On some evaluations there will be differences of opinion about how to score the matrix cell. What to do? If each member of the team completes a decision matrix and the results are averaged, it is like mixing different paint colors – you will end up with brown. Further, there are well known decision rules that show the weaknesses in combining evaluation results (Scott
2000). Finally, the team members’ interpretation of the available information may be conflicting. Conflicting interpretations occur naturally due to differences in background, role in the project, interpretation of the information, expertise, and problem solving style. Conflicts are not good or bad, just different interpretations of the available information.
• Combine qualitative and quantitative information in a uniform manner Early in the design process evaluations are a mix of qualitative and low fidelity simulations. Fidelity is the degree to which a model or simulation reproduces the state and behavior of a real world object. Increasing fidelity requires an increase in refinements and added costs to the project. Generally, with increased fidelity comes increased knowledge, but not necessarily. It is possible to use a high fidelity simulation to
model garbage and thus do nothing to reduce uncertainty. Often, especially in early trade studies, there are no formal simulations and all or most of the evaluations are qualitative. These evaluations may be no less valid than detailed simulations. In fact, it has been argued that gut-feel and intuition is the key to good decisions (Klein 2003).
• Manage criteria target utility
Criteria targets can be represented by utility curves that range from delighted values (utility =1) to disgusted values (utility =0). These can be used to discount alternatives that do not meet the ideal, but are still acceptable. They also have the potential for helping manage tradeoffs, accepting good performance relative to one criterion versus poor performance relative to another criterion.
A method that can meet these requirements has recently become available. The methodology is called Bayesian Team Supportâ„¢ (BTS). BTSâ„¢ was developed in direct response to the decision matrix weaknesses found by Bob, Anne and Marcus and will be introduced in the next section. BTS leads to methods that require complex mathematics and the need for computer support. Thus, the section after the BTS introduction will make use of a commercially available program to show how BTS can be applied to the
example TRIZ problem.
Details on Bayesian Team Support
Bayesian Team Support (BTS) is based on Bayesian decision theory which has its roots in the work of an obscure 18th century cleric (Rev. Bayes) who worried about how to combine evidence in legal matters. However, its modern form traces to the work of John Von Neumann, mathematician and computer pioneer, in the 1940s; and J. Savage in the 1950s. In Savage’s formulation (Savage 1955), a decision problem has three elements: (1) beliefs about the world; (2) a set of action alternatives; and (3) preferences over the possible outcomes of alternate actions. Given a problem description, the theory prescribes that the optimal action to choose the alternative that Maximizes the Subjective Expected Utility (MSEU). Bayesian decision theory excels in situations characterized by uncertainty and risk, situations where the available information is imprecise, incomplete, and even inconsistent, and in which outcomes can be uncertain and the decision-maker’s attitude towards them can vary widely. Bayesian decision analysis can indicate not only the best alternative to pursue, given the current problem description, but also whether a problem is ripe for deciding and, if not, how to proceed to reach that stage. However, there is a well-known problem in applying Bayesian decision theory to problems involving multiple decision-makers: there was no known sound way to integrate the preferences of multiple decision-makers.
Recently methods have been developed to solve this problem, extending the application of Bayesian methods to team decision-making and the fusion of qualitative and quantitative evaluations. These methods are referred to Bayesian Team Support. They also significantly extend the scope of Bayesian modeling to problem-formulation, previously only available in informal decision-making methods that provide no analytical support. The Bayesian mathematics to combine the knowledge and confidence is not
trivial and there is not space in this paper to explain it. For more details see D’Ambrosio 2005.
Without going into details about the mathematics, the process and results will become clearer in the continuation of the example. The Team’s Application of Bayesian Team Support to solve the Problem
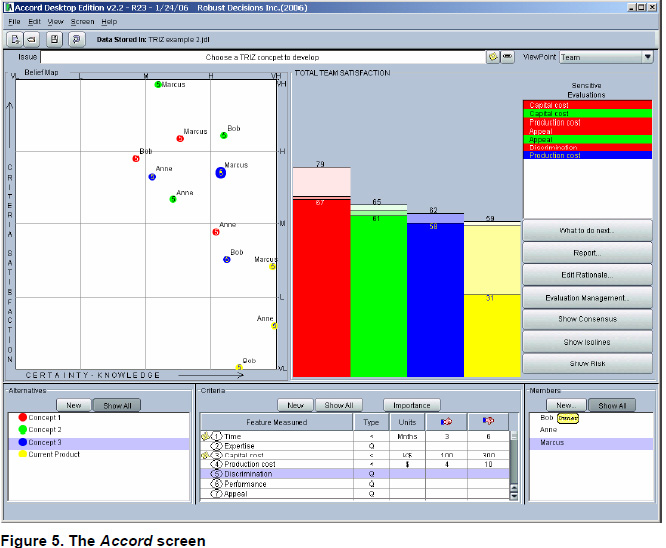
The team decided to apply the BTS methods to support their deliberation. A short overview of how this worked and what they learned follows. Since BTS can not be accomplished by hand and since the team was distributed in two cities, they decided to use the Accord software BTS toolset6. This software can support teams distributed in time and location. Each team member saw a screen as shown in Figure 5.
The bottom of the screen shows how the team framed the problem – shown in detail in Figure 6. They input the alternatives as text strings with links to details developed during the use of TRIZ. Here each alternative has a unique color, Concept 1 = red, Concept 2 = blue, Concept 3 = green and Current Product = yellow. The criteria were entered and each numbered 1-7. The team left the qualitative labeled with a default “Q†and changed those that are quantitative to indicate their direction of goodness (less is better, more is better, or specific target is best) and entered, the delighted and disgusted values and units. This is all managed in a pop-up window that isn’t shown here.
Each of the team members entered their importance weightings using any of three algorithms; Sum, Independent or Rank (Figure 7). Marcus’ used the Rank method where he simply ordered the criteria as he did in Figure 2 and the weights were automatically assigned. Bob used the Sum method where he moved the sliders individually and they self normalized to always sum to 1.0. The team did their evaluations on a Belief Map (Figure 8). A Belief Map provides a novel, yet intuitive, means for entering/ displaying qualitative evaluation results in terms of knowledge, certainty, satisfaction and belief. Belief maps offer a quick and easy-to-use tool for an individual or a team to ascertain the status of an alternative’s ability to meet a criterion, to visualize the change resulting from analysis, experimentation or other knowledge increase or uncertainty decrease, and to compare the evaluations made by the team members. Each point on the belief map is color coded to match the
alternatives and numbered to match the criteria.

The example Belief Map shown in Figure 8 displays the points on the Belief Map for the entire team
evaluating the Discrimination of the alternatives. Each dot is placed by the evaluator independently and then fused automatically. The one larger point is the one that is active and can be moved
on the Map. On this map the points for the Current Product are all in the lower right corner showing the team’s high certainty that it is not well discriminated from the competition.
For Concept 1 (the red points) Bob thinks the discrimination is high, but his certainty about this is medium. Anne on the other hand, feels more certain than Bob that the discrimination is medium.
For qualitative evaluations the vertical axis represents the “criterion satisfaction”- how well the alternative being evaluated satisfies the criterion. This is analogous to the scoring in a decision matrix (aka Pugh’s matrix). The horizontal axis is referred to “certainty-knowledge†as the evaluator’s certainty or knowledge is the basis of the assessment. The logic behind the belief values is easily explained. If an evaluator puts her point in the upper right corner, then she is claiming she is an expert and is confident that alternative fully meets the criterion. If she puts her point in the lower right corner, she is expert and confident that the alternative has a zero probability of meeting this criterion. If she puts her evaluation point in the upper left corner she is hopelessly
optimistic: “I don’t know anything about this, but I am sure it will work†– she believes that alternative meets the criterion even though she has no knowledge on which to base this belief. This
is referred to as “the salesman’s corner.” If she puts her evaluation point in the lower left corner she is pessimistic “I know nothing, but it will be bad”. This is called the “engineer’s corner†for obvious reasons.
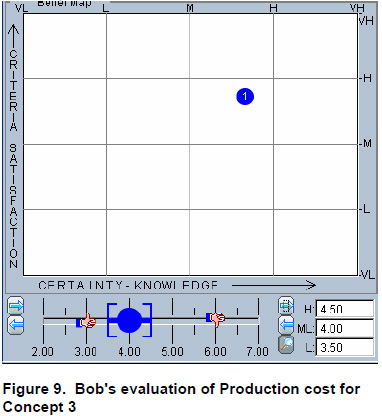
For quantitative criteria, the team used a Number Line to input their uncertain evaluations. Figure 9
shows Bob’s evaluation of the Production Cost for Concept. As shown, he believes the cost will be $4.00 but could be as high as $4.50 or as low as $3.508. This point is shown on the belief map as high
criterion satisfaction and mediumhigh certainty.

All the evaluations were automatically fused and then weighted using each of the three importance viewpoints – one input by each of the team members. Accord performs many different types of analyses based on the input data. The first output the team looked at was the satisfaction bar chart shown in Figure 10. Here, there is one bar for each alternative and each bar shows the satisfaction from each of the different view points.
For Concept 1, the first, red bar shows that, depending on whose viewpoint is considered, the satisfaction ranges from 60% to 76%. Concept 1 appears to be a little more satisfactory than the other two, but not sufficiently to make a decision to choose it. The Satisfaction Bars can be also be displayed for each team member individually.
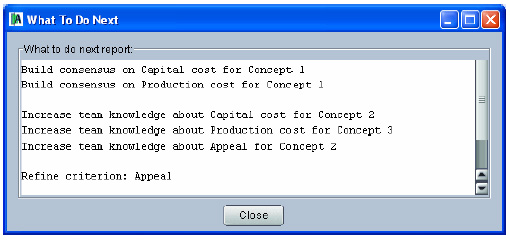
Based on the input data, a What-To-Do-Next analysis (Figure 11) was performed to generate an ordered list of what the decision-maker(s) should do next to improve the differentiation in satisfaction
between the highest ranked alternative, or the probability that the highest ranked alternative is best. The top items on the list generally have the best cost/benefit ratio.
The “What-To-Do-Next suggestions are typically either:
• Evaluation can be improved by gaining consensus on specific items, e.g., Capital Cost for Concept 1. This means that the information from the various sources does not agree and formalized process to resolve the inconsistency can result in increased shared knowledge and confidence in the evaluation.
• Evaluation can be improved by gathering more information, e.g. Capital Cost of Concept 2. Again, only those areas that can significantly affect the satisfaction bars are identified.
• Refine the qualitative criteria
• Develop better differentiated alternatives
• Choose alternative X. This only occurs when the evidence is overwhelming that one alternative is better than the others and has an average satisfaction value about 70%.
Based on the What-To-Do-Next report, the team worked on building consensus on the Capital Cost for Concept 1. In discussing why they didn’t agree, they concluded that they were using different assumptions in the analyses. Some discussion on this point led them to reevaluate this measure resulting in the updated belief map shown in Figure 12.
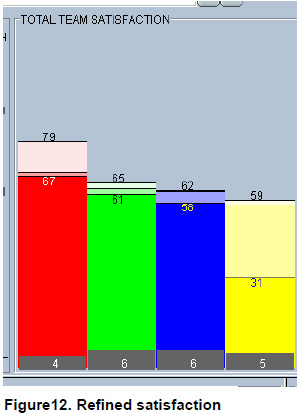
The team also looked at decision risk, also shown in Figure 12. This takes two forms.
First, the difference between the satisfaction values and 100% is that the choice will not meet the ideal as set by the unstated goals used by evaluators for qualitative criteria and the delighted values for quantitative criteria.
Further, since the analysis is based on uncertain information, the satisfaction values themselves could be high by the amount shown in the gray area at the bottom of the bars. In other words, the 67-79% for Concept 1 may be 4% lower – 63%-75%. The team continued to follow the What-To- Do-Next advice and Concept 1 evolved as the clearly superior concept. Even taking uncertainty into account, it was much more satisfactory than the Current Product (the forth, yellow bar).
Accord printed a report of the decision and also kept a history of the rationale used to make the decision. Further, the criteria entered were reused by the team to make future TRIZ decisions.
Summary
The team was very satisfied using the BTS methodology. It helped them:
• Manage uncertainty
• Manage incomplete information
• Determine what-to-do-next
• Fused distributed team evaluations
• Allowed analysis from multiple viewpoints
• Combined qualitative and quantitative evaluation information
• Gave a visual method of entering evaluation information
In all, it supported the TRIZ results in a unique and easy-to-use way.
References
D’Ambrosio, 2005) B. D’Ambrosio “Bayesian Methods for Collaborative Decision-Makingâ€, www.robustdecisions.com/bayesianmethoddecisions.pdf
(Klein 2003) G. Klein, The Power of Intuition, Currency Books, 2003 (Pugh 1990) S. Pugh, Total Design, Addison Wesley, 1990
Figure12. Refined satisfaction
(Savage 1955) Savage L.J., Foundations of Statistics, 1955 (2nd Revised edition,Dover, 1972).
(Scott 2000) M. J. Scott and E. K. Antonsson, “Arrow’s Theorem and Engineering Design Decision Makingâ€, Research in Engineering Design, Volume 11, Number 4 (2000), pages 218-228.
(Ullman 2003) D. G. Ullman, The Mechanical Design Process, 3rd edition, McGraw Hill, 2003


