
More On Innovation Timing: Discontinuity Rate

Editor | On 02, Mar 2006
Darrell Mann
Systematic Innovation Ltd, UK
E-mail: darrell.mann@systematic-innovation.com
1. Introduction
In January’s article on innovation timing, a prototype algorithm was presented (Reference 1). Within that algorithm was a factor labelled ‘discontinuity rate’. The aim of this article is to expand on the definition provided in the first article by describing the origins of the factor, its method of calculation, and finally its potential implications in the strategic planning process within innovating organisations. In order to illustrate each of these aspects the article will use data from two previous innovation studies – one on wind-turbine aerodynamics (Reference 2) and one on gasturbine fan aerodynamics (Reference 3).
By way of a reminder of the definition of the discontinuity rate term, Reference 1 describes how the Evolution Potential concept (Reference 4) has generated a means whereby discontinuous innovation jumps can be mapped onto a globally generic framework. By plotting the progression of systems along the discontinuous jumps provided within this framework as a function of time we are thus able to calculate the rate at which jumps are being made. Figure 1 illustrates the usual radar plot method of describing discontinuous evolution jumps. The figure describes the evolution of windturbine aerodynamics from the earliest windmills to the present day. Each advance along each spoke of the radar plot represents one discontinuous evolution jump.

Crudely speaking, what this plot tells us is that the blades of a wind-turbine have made around 17 discontinuous trend jumps since their initial inception. These jumps have taken place over a period of around 130 years, and so as an overall average value, the discontinuity rate for the wind-turbine industry can be calculated as 17/130, or 0.13 trend jumps per year.
While this overall figure is useful to know, a more valuable calculation would examine the possible changes in discontinuity rate that might occur over time. In other words, if we are to make serious strategic use of the discontinuity rate we would like to know whether the present rate is different from the historical rate. Figure 2 illustrates a graph of wind-turbine aerodynamic discontinuity rate as a function of time.

What we notice from this graph is that there is a distinctly rising rate of discontinuities in this sector – put simply, trend jumps are occurring more frequently now than they did back in the 19th and early 20th century. By taking logarithms of the discontinuity rate values, we see the emergence of a straight-line relationship between trend jumps and time – Figure 3.

As we shall show in a future series of articles on discontinuity rate in other industries, this straight-line log correlation remains largely consistent. The only thing that will be likely to change in fact is the overall slope of the line. Thus, to take a second example, when we plot the equivalent discontinuity rate versus time characteristic for gas turbine fan aerodynamics we see a considerably steeper slope than that for the wind turbine sector (Figure 4). According to this plot, the evolution rate of gas-turbine fans is almost three times faster than that for wind-turbines.

Figure 5 provides a pictorial representation of the implications of this markedly different discontinuity rate slope on the changing physical appearance of the respective blade systems over time.
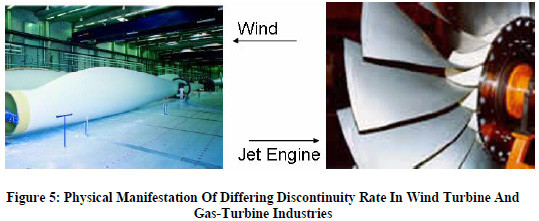
Without taking into account any of the possible exceptions that might cause these two evolution rates to change in the future described in Reference 1, the implications of Figure 5 is that we can expect wind-turbine aerodynamics to progressively make use of jumps already proven in the gas-turbine sector. Like:
– increased curvature (swept-back blades will offer certain aerodynamic efficiency and noise reduction benefits)
– local 3D features at the root and tip of the blade – better control of vortex shedding behaviour
– incorporation of ‘kinks’ and local bends along the length of the blade
While the innovation timing algorithm will not tell us which of these jumps might occur before another, the timing algorithm and the Figure 3 characteristic can be expected to give us a pretty good indication as to when the first of these jumps might start to appear on the market. In this instance, that time is likely to be by 2007 at the latest.
9. Final Thoughts And Next Steps
An important distinction needs to be made between innovation timing and protection timing. Innovation timing is when an organisation decides it is appropriate to launch an innovative product or service onto the market. Protection timing is the time when we have the idea and decide to go public via the submission of a patent or equivalent intellectual property protection action. Clearly the protection activity is likely to occur before the market launch activity. One of the vital capabilities offered by the TRIZ discontinuous evolution trends is that we can very readily anticipate what the ideas will be. We can see this here when we look at the likely future evolution directions of the wind-turbine blade. The question now becomes which and how many of these ideas should we look to be protecting now. Even though we may not choose to put any of those ideas on the market, we can at least prevent others from doing it before us.
Looked at from this perspective, a simple yet effective innovation strategy is likely to use the TRIZ trends and ‘voice of the product’ (Reference 5) to identify what ideas need to be protected, and to then seek the relevant protection. Our ‘voice of the customer’ knowledge should then tell us which of the jumps is going to be more important than others. This finally then leaves us with the timing algorithm, which should be used in order to answer the question of when that next discontinuous jump ought to be introduced to the market. Obviously, as stated in Reference 1, the innovation timing algorithm is still at an early stage in its evolution. From our side, the key to its future success is the continuing acquisition of new data. We invite other researchers to join our team in this process.
References
1) Mann, D.L., ‘On Innovation Timing’, TRIZ Journal, January 2006.
2) Mann, D.L., (2004a), ‘Fan Technology: Evolution Potential And Evolutionary Limits’, paper presented at IMechE International Conference On Fans, London, 9-10 November, 2004.
3) Mann, D.L., (2005), ‘Compressor System Technology: Evolution Potential And Evolutionary Limits’, paper presented at IMechE International Conference On Compressors And Their Systems, London, 4-7 September, 2005.
4) Mann, D.L., (2002), ‘Hands-On Systematic Innovation’, CREAX Press.
5) Mann, D.L., ‘Unleashing The Voice Of The Product And The Voice Of The Process’, paper to be presented at TRIZCON2006, Milwaukee, May 2006.